Making Caddy logs more readable

Hello

I open this thread to discuss strategies to use the JSON logs created by Caddy 2.

Since I’m mostly using the command tail to consume the logs directly in my terminal window, the default presentation is not great at all :

I found a really simple solution though. I installed jq and now I can output a more readable log just by adding jq after the tail, like this :

tail -f /var/log/caddy/voiretmanger.fr.access.log | jq

This is what I get (I’m using ZSH and oh-my-zsh, which explains the colors used) :

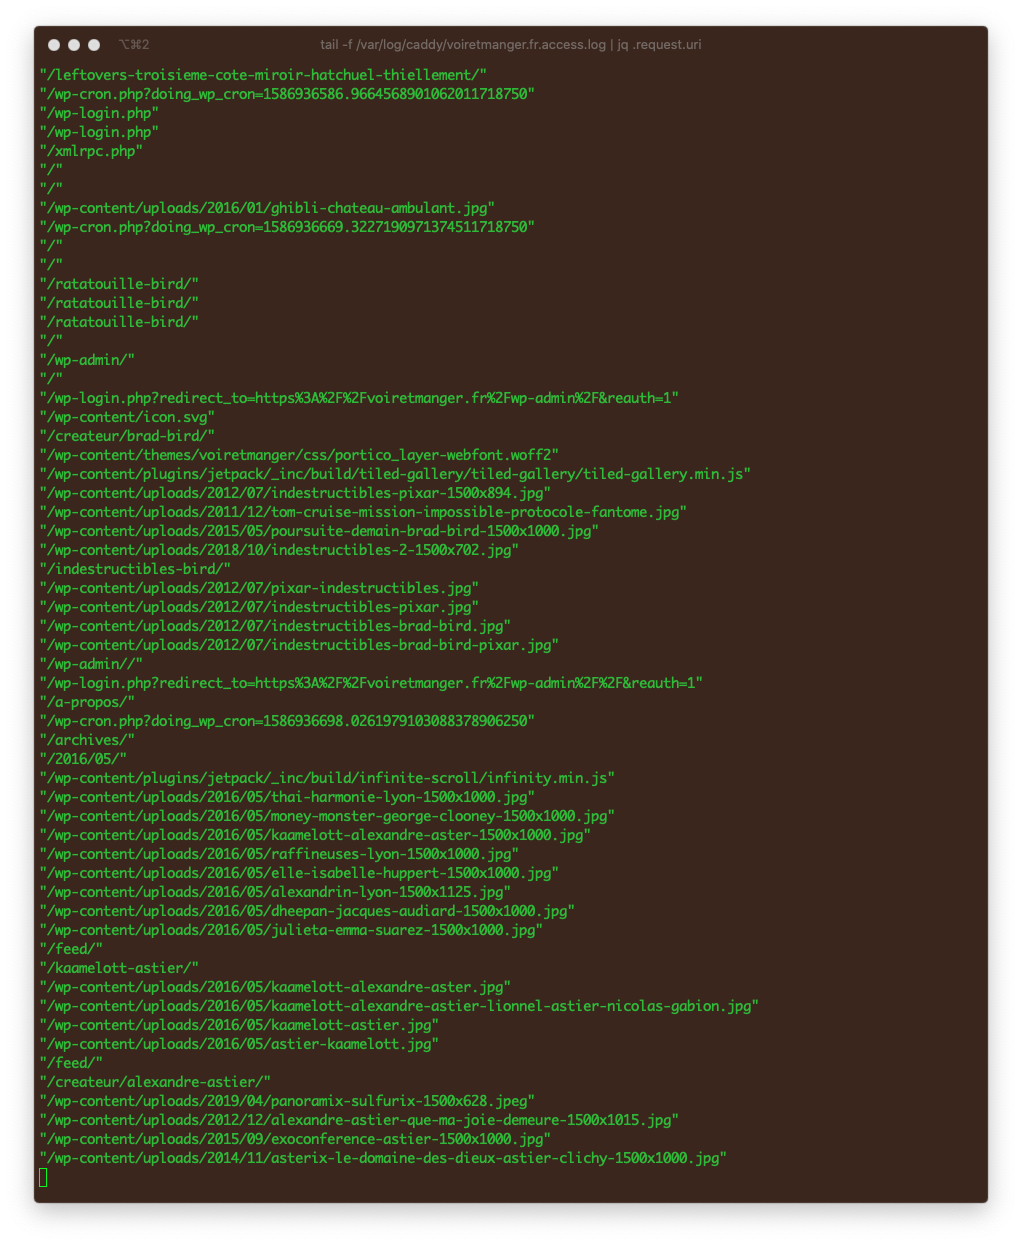
Another benefit of jq is that you can filter the output to display only one information. For instance, if you only want to see the requests uri, you can do :

tail -f /var/log/caddy/voiretmanger.fr.access.log | jq .request.uri

And this is what you will get :

You could use that filter to display the common log, still available in the default log outputted by Caddy 2 :

tail -f /var/log/caddy/voiretmanger.fr.access.log | jq .common_log

You can even display multiple informations at once, using a comma between each element, like so :

tail -f /var/log/caddy/voiretmanger.fr.access.log | jq '.request.uri, .request.remote_addr'

The jq documentation contains more example of filtering available : jq Manual (development version)

It’s pretty basic, but it’s usually enough for my limited needs. If you have a different system, I would be interested to see what you do !

17 Likes

This is a fantastic writeup, @nicolinux!

Would it be alright with you if I made this a wiki so that others can find it easier? I think there’s some really good info here and over time the rest of the community can contribute back to it.

2 Likes

No problem at all, I’m glad it can be useful. :slight_smile:

Alright, this is a really neat little tool and super useful! Thanks for pointing it out, makes it really easy to inspect logs without setting up more advanced log parsing or mangling Caddy’s default comprehensive structured logging.

Thank to this thread I could reformat the caddy json output to something that I am familiar with and that I can easily further process with awk piped into iptables (ipset) for banning purposes.

jq -j '.ts |= strftime("%Y-%m-%d %H:%M:%S") | .request.remote_addr |= .[:-6]  | .ts, "|", .request.remote_addr,"|", .request.uri,"|", .request.method,"|", .request.proto,"|", .status,"|", .request.headers."User-Agent"[]+"\n"' /var/log/caddy/access.log

This jq snippet outputs this

2020-04-22 14:23:05|192.168.0.92|/info.php|GET|HTTP/1.1|200|curl/7.64.0
2020-04-22 14:23:51|192.168.0.92|/info.php|GET|HTTP/1.1|200|Mozilla/5.0 (X11; Linux x86_64) AppleWebKit/537.36 (KHTML, like Gecko) Chrome/80.0.3987.162 Safari/537.36
2020-04-22 14:23:51|192.168.0.92|/favicon.ico|GET|HTTP/1.1|404|Mozilla/5.0 (X11; Linux x86_64) AppleWebKit/537.36 (KHTML, like Gecko) Chrome/80.0.3987.162 Safari/537.36
2020-04-22 14:28:35|192.168.0.92|/info.php|GET|HTTP/1.1|200|Mozilla/5.0 (X11; Linux x86_64) AppleWebKit/537.36 (KHTML, like Gecko) Chrome/80.0.3987.162 Safari/537.36
2020-04-22 14:28:50|192.168.0.92|/|GET|HTTP/1.1|200|Mozilla/5.0 (X11; Linux x86_64) AppleWebKit/537.36 (KHTML, like Gecko) Chrome/80.0.3987.162 Safari/537.36
2020-04-22 14:28:50|192.168.0.92|/favicon.ico|GET|HTTP/1.1|404|Mozilla/5.0 (X11; Linux x86_64) AppleWebKit/537.36 (KHTML, like Gecko) Chrome/80.0.3987.162 Safari/537.36
2020-04-22 14:29:30|192.168.0.92|/info.php|GET|HTTP/1.1|200|Mozilla/5.0 (X11; Linux x86_64) AppleWebKit/537.36 (KHTML, like Gecko) Chrome/80.0.3987.162 Safari/537.36
2020-04-22 14:32:38|192.168.0.92|/info.php|GET|HTTP/1.1|200|Mozilla/5.0 (X11; Linux x86_64) AppleWebKit/537.36 (KHTML, like Gecko) Chrome/80.0.3987.162 Safari/537.36

I am impressed by the power of jq although its syntax is a bit cumbersome.

10 Likes

@JeanLucLacroix are you using fail2ban with your reformatted caddy logs?

No, I use my own awk script that scans the logs and bans ip’s that keep on insisting to connect more that a preset number of times per minutes. Infringing ip’s are added to an ipset hooked to iptables. ipset is handy as it doesn’t require iptables rules to be reloaded when changed.

Sorry for the late answer.

Thanks for getting back to me.

Thank you for writing this post very useful if you want to navigate caddy logs via cli.

I wanted to present an alternative method involving grafana, loki (data source for logs) and promtail (loki collector). After installing those in your system, you need to update the loki config to scape journald by adding this to the promtail config (/opt/promtail/promtail-local-config.yaml in my system):

...
- job_name: journal
  journal:
    json: false
    max_age: 12h
    path: /var/log/journal
    labels:
        job: systemd-journal

After that, you can go to grafana and explore the loki source to create graphs for the metrics you are interested on.

If anyone knows of a grafana caddy dashboard that we can import please let us know.

I found this one by user mgsh in the grafana dashboards website. It works just fine right after importing and it provides useful info. Definitely a good starting point. Be aware it uses a prometheus data source not loki.

Cheers,
-drd

3 Likes

Thanks for making this article, it helped me as well to figure out how to make the logs more readable.

I ended up making some aliases to fetch the logs and update things on a caddy VM I use with systemd and thought, why not share it as well if someone else might find it useful too? :pray: :seedling: :bowing_man:

.bash_aliases

# # # VARIABLES # # #
CADLOG="/var/log/caddy/caddy.log"
CADFILE="/etc/caddy/Caddyfile"
API="http://localhost:2019"

# # # ALIASES # # #
alias cadstart="systemCtl start caddy"
alias cadstop="systemCtl stop caddy"
alias cadenable="systemCtl enable caddy"
alias cadisable="systemCtl disable caddy"
alias cadreload="systemCtl reload caddy"
alias cadrestart="systemCtl restart caddy"
alias cadstatus="systemCtl status caddy"
alias daemonreload="systemCtl daemon-reload"

# # # FUNCTIONS # # #
function systemCtl {
	sudo systemctl ${@}
}

function cad {
	sudo -u caddy -E ${@}
}

cadfile() {
	cad /usr/bin/nano ${CADFILE}
}

cadformat() {
	cad caddy fmt --overwrite ${CADFILE}
}

cadlog() {
	cad cat ${CADLOG} | jq -S ${@}
}

jsonlog() {
	cad cat ${CADLOG} | jq -j ${@}
}

logtime() {
	cad cat ${CADLOG} | jq -S '.ts | strflocaltime("%Y-%m-%d %H:%M:%S %Z")'
}

checklog() {
	cad cat ${CADLOG} | tail | jq -S ${@}
}

ts() {
	cad cat ${CADLOG} | jq -S '.ts'
}

getIP() {
	local DALOG
	DALOG=$( cadlog | grep 'authorization failed' | awk '{print $5}' | cut -d"=" -f2 | sort | uniq -i | sed 's/,//g' )
	printf '%s\n' "${DALOG[@]}"	
}

cX() {
if [[ "$*" == "GET" ]] || 
	[[ "$*" == "PUT" ]] || 
	[[ "$*" == "POST" ]] || 
	[[ "$*" == "PATCH" ]] || 
	[[ "$*" == "DELETE" ]] ||
	[[ "$*" == "OPTIONS" ]]; then
	curl -X ${@}
else
	curl ${@}
fi
}
header() {
	-H "Content-Type: application/json"
}
djson() {
	-d @caddy.json
}
dcaddy() {
	--data-binary @Caddyfile
}
caddyAPI() {
if [[ $# -eq 0 ]]; then
  echo "I'm a teapot."
elif [[ "$*" == "get-config" ]] || [[ "$*" == "-gc" ]]; then
	cX GET ${API}/config/ | jq -S
elif [[ "$*" == "health-proxies" ]] || [[ "$*" == "-hp" ]]; then
	cX GET ${API}/reverse_proxy/upstreams | jq -S
elif [[ "$*" == "stop" ]] || [[ "$*" == "-s" ]]; then
	cX POST ${API}/stop
elif [[ "$*" == "load" ]] || [[ "$*" == "-l" ]]; then
	cX POST ${API}/load
else
	echo "I'm a teapot."
fi

}

Caddyfile Global Config Log

	log {
		output file /var/log/caddy/caddy.log {
			roll_size 12mb
			roll_keep 10
			roll_keep_for 2160h
		}
		format json {
			message_key msg
			level_key level
			time_key ts
			name_key name
			time_format wall
		}
	}

/etc/systemd/system/caddy.service

# caddy.service
#
# For using Caddy with a config file.
#
# Make sure the ExecStart and ExecReload commands are correct
# for your installation.
#
# See https://caddyserver.com/docs/install for instructions.
#
# WARNING: This service does not use the --resume flag, so if you
# use the API to make changes, they will be overwritten by the
# Caddyfile next time the service is restarted. If you intend to
# use Caddy's API to configure it, add the --resume flag to the
# `caddy run` command or use the caddy-api.service file instead.

[Unit]
Description=Caddy
Documentation=https://caddyserver.com/docs/
After=network.target network-online.target
Requires=network-online.target

[Service]
Type=notify
User=caddy
Group=caddy
ExecStart=/usr/bin/caddy run --environ --config /etc/caddy/Caddyfile
ExecReload=/usr/bin/caddy reload --config /etc/caddy/Caddyfile
TimeoutStopSec=5s
LimitNOFILE=1048576
LimitNPROC=512
PrivateTmp=true
ProtectSystem=full
AmbientCapabilities=CAP_NET_BIND_SERVICE

[Install]
WantedBy=multi-user.target

3 Likes

Just want to add, if your using docker you can do it like this:

Changing caddy to whatever you’ve named it.
docker logs caddy 2>&1 | jq

1 Like

Here is one more helpful commands if you are using Caddy with Cloudflare:

To show the source country of the request, the original connecting id and CloudFlare RAY request id for diagnosing errors:

tail -f logs/access.log | jq '[.status, .request.remote_addr, .request.uri] | join(" ")'

We are also using join(" ") to make jq to output one log entry per one line of stdout.

Output looks like

"200 (hidden) DE 79007d973dd4c2be-VIE /"
"200 (hidden) DE 79007d972d8ac27a-VIE /"
"200 (hidden) DE 79007d973c3dc287-VIE /"
"200 (hidden) DE 79007d9729b2c240-VIE /"
"200 (hidden) DE 79007d9788f83244-VIE /state"
1 Like

I have a script on Github that makes Caddy’s JSON logs look similar to Apache/Nginx’s logs:

Usage: tail -f LOGFILE | python3 caddy.py

1 Like

FYI, you could use GitHub - caddyserver/transform-encoder: Log encoder module for custom log formats instead which has a built-in common log format.

2 Likes

Here is another jq one-liner to grep errors from Caddy access logs:

cat logs/access.log | jq 'select(.status >= 500) | [.status, .request.host, .request.uri ] | join(" ")'

Using strflocaltime converts to local timezone

jq '.ts |= strflocaltime("%Y-%m-%dT%H:%M:%S %Z")'
1 Like

jq (and/or jaq) are great tools to filter output.

I’d also recommend fx for an interactive experience.

1 Like

While the json output is comprehensive, it is rather combersome to not have a formatted output. Are there any good (free/open source) log file parser and monitor tools?

I do agree with Caddy authors to use the full json format, as it contains all relevant data. However, it is also not super easy to parse with human eyes :eyes:.

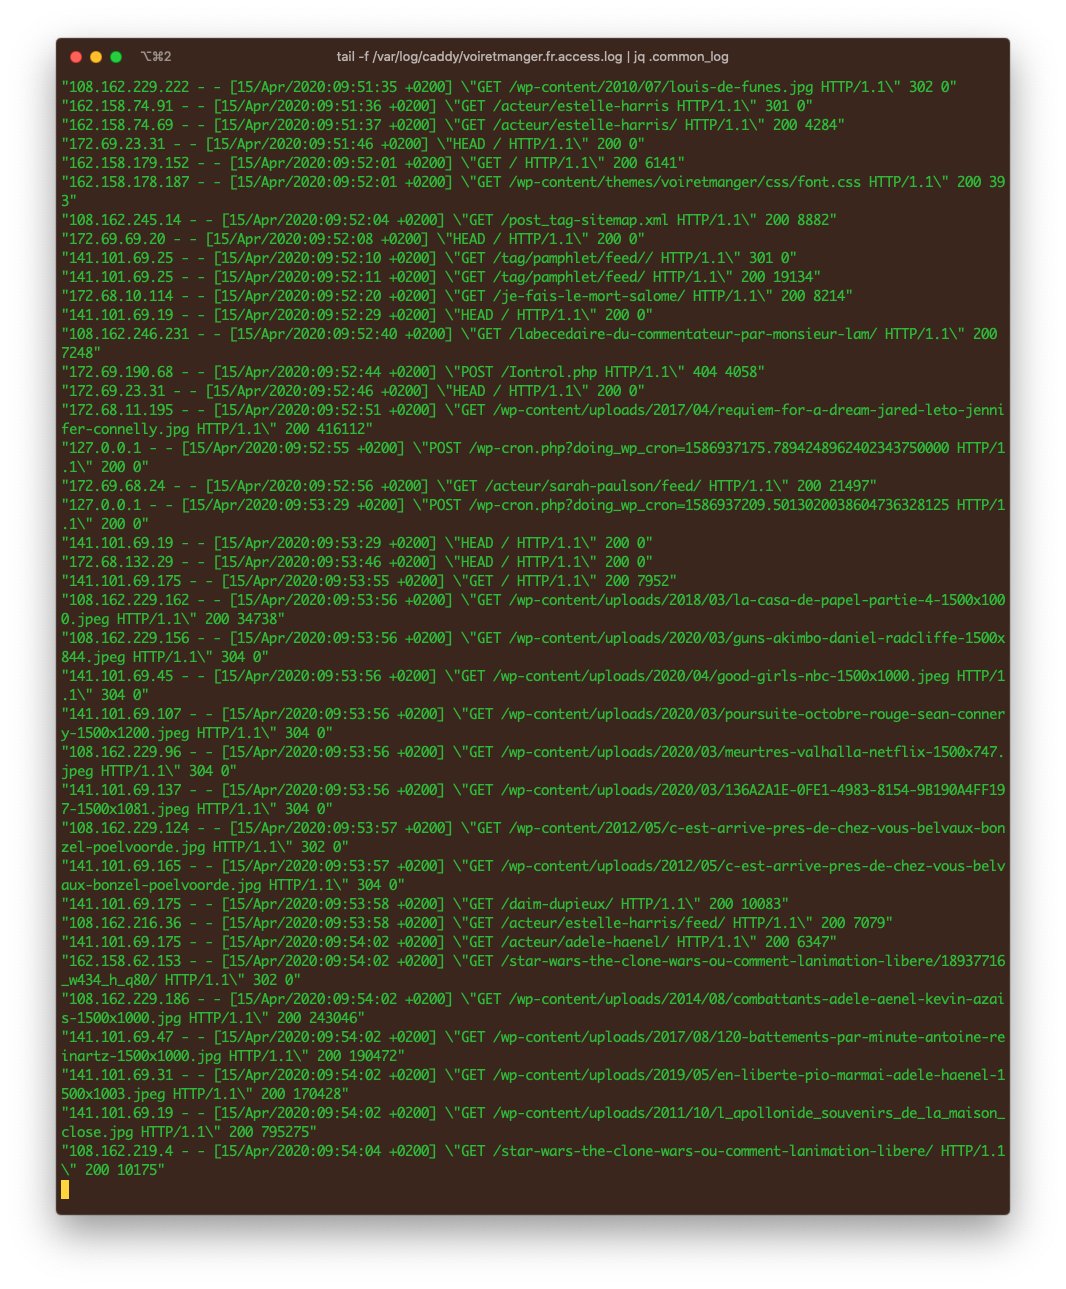
I looked at jq, and it’s a little alien to me, but here is an attempt to make a json parser that output in Common Log format or in Combined Log format.

Perhaps we can improve on it together? I don’t particularly like the timestamp after the client_ip or user_id, but it should easy be able to add additional custom log formats.

logparse.sh

#!/bin/bash

###
### Caddy webserver JSON log parser
###

show_help() {
	cat <<END
Usage: $0 [-c|--common] [-C|--combined] [-f|--files] [-h|--help] filename

Options:
  -c, --common     Apache Common Log Format (default)
  -C, --combined   Apache Combined Log Format
  -f, --files      Custom Log Format, focused on file transfers
  -h, --help       Show this help message and exit
END
}

# Function to output logs in common log format
output_common_log_format() {
	jq -r '
		. as $log |
		$log.request.client_ip as $h |
		"-" as $l |
		($log.user_id // "-") as $u |
		($log.ts | tostring | split(".") | .[1][:3]) as $ms |
		($log.ts | floor | todateiso8601 | sub("T"; " ") | sub("Z"; "." + $ms + " +0000")) as $t |
		"\($log.request.method) \($log.request.uri) \($log.request.proto)" as $r |
		$log.status as $s |
		($log.size // "-") as $b |
		"\($h) \($l) \($u)[\($t)] \"\($r)\" \($s) \($b)"
	' "${1}"
}

# Function to output logs in combined log format
output_combined_log_format() {
	jq -r '
		. as $log |
		$log.request.client_ip as $h |
		"-" as $l |
		($log.user_id // "-") as $u |
		($log.ts | tostring | split(".") | .[1][:3]) as $ms |
		($log.ts | floor | todateiso8601 | sub("T"; " ") | sub("Z"; "." + $ms + " +0000")) as $t |
		"\($log.request.method) \($log.request.uri) \($log.request.proto)" as $r |
		$log.status as $s |
		($log.size // "-") as $b |
		($log.request.headers.Referer[0] // "-") as $referrer |
		($log.request.headers["User-Agent"][0] // "-") as $user_agent |
		"\($h) \($l) \($u)[\($t)] \"\($r)\" \($s) \($b) \"\($referrer)\" \"\($user_agent)\""
	' "${1}"
}

output_file_log_format() {
	jq -r '
		. as $log |
		$log.request.client_ip as $h |
		"-" as $l |
		($log.user_id // "-") as $u |
		($log.ts | tostring | split(".") | .[1][:3]) as $ms |
		($log.ts | floor | todateiso8601 | sub("T"; " ") | sub("Z"; "." + $ms + " +0000")) as $t |
		"\($log.request.method) \($log.request.uri) \($log.request.proto)" as $r |
		$log.status as $s |
		($log.size // "-") as $b |
		($log.request.headers.Referer[0] // "-") as $referrer |
		($log.request.headers["User-Agent"][0] // "-") as $user_agent |
		"\($h) \($l) \($u)[\($t)] \"\($r)\" \($s) \($b) \"\($referrer)\" \"\($user_agent)\""
	' "${1}"
}

# Function to list served files
list_served_files() {
	jq -r '
		.request.client_ip as $client_ip |
		(.ts | floor | todateiso8601 | sub("T"; " ") | sub("Z"; " +0000")) as $datetime |
		.status as $status_code |
		(.size // "-") as $size |
		.request.uri as $filename |
		"\($client_ip) [\($datetime)] \($status_code) \($size) \"\($filename)\""
	' "${1}"
}

# Default to common log format
format="common"

# Parse command line options
while [[ "$#" -gt 0 ]]; do
	case $1 in
		-c|--common)
			format="common"
			shift
			;;
		-C|--combined)
			format="combined"
			shift
			;;
		-f|--files)
			format="files"
			shift
			;;
		-h|--help)
			show_help
			exit 0
			;;
		*)
			input="${1}"
			shift
			;;
	esac
done

# Check if a filename is provided
if [ -z "${input}" ]; then
	echo -e "Error: No input file provided. \n"
	show_help
	exit 1
fi


# Output the logs in the chosen format
if [ "$format" = "common" ]; then
	output_common_log_format "${input}"
elif [ "$format" = "files" ]; then
    list_served_files "${input}"
else
	output_combined_log_format "${input}"
fi

# Apache Commong Log format:
# "%h %l %u %t \"%r\" %>s %b"

# Apache Combined LogFormat:
# "%h %l %u %t \"%r\" %>s %b \"%{Referer}i\" \"%{User-agent}i\"" 

# %h is the remote host (client IP)
# %l is the remote logname (not used, so we'll use -)
# %u is the authenticated user
# %t is the time the request was received
# %r is the request line from the client ("method uri proto")
# %>s is the status code
# %b is the size of the object returned to the client

Common Log format

192.168.0.132 - [2024-05-19 21:29:16.764 +0000] "GET /gentoo/gentoo-portage/ HTTP/3.0" 200 7083
2a03:2880:22ff:75::face:b00c - [2024-05-19 21:29:18.322 +0000] "GET /gentoo/gentoo-distfiles/distfiles/89/podcast-0.0.4.gem HTTP/2.0" 200 1166848
192.168.0.132 - [2024-05-19 21:29:19.632 +0000] "GET /gentoo/gentoo-portage/header.txt HTTP/3.0" 200 99

Combined format

192.168.0.132 - [2024-05-19 21:29:16.764 +0000] "GET /gentoo/gentoo-portage/ HTTP/3.0" 200 7083 "https://mirrors.tnonline.net/gentoo/" "Mozilla/5.0 (Linux; Android 14; SM-S908B) AppleWebKit/537.36 (KHTML, like Gecko) Chrome/124.0.6367.179 Mobile Safari/537.36 OPR/82.3.4342.79590"
2a03:2880:22ff:75::face:b00c - [2024-05-19 21:29:18.322 +0000] "GET /gentoo/gentoo-distfiles/distfiles/89/podcast-0.0.4.gem HTTP/2.0" 200 1166848 "-" "facebookexternalhit/1.1 (+http://www.facebook.com/externalhit_uatext.php)"
192.168.0.132 - [2024-05-19 21:29:19.632 +0000] "GET /gentoo/gentoo-portage/header.txt HTTP/3.0" 200 99 "https://mirrors.tnonline.net/gentoo/gentoo-portage/" "Mozilla/5.0 (Linux; Android 14; SM-S908B) AppleWebKit/537.36 (KHTML, like Gecko) Chrome/124.0.6367.179 Mobile Safari/537.36 OPR/82.3.4342.79590"
1 Like

You can also use the transform-encoder to format the logs into a template

4 Likes