1. The problem I’m having:
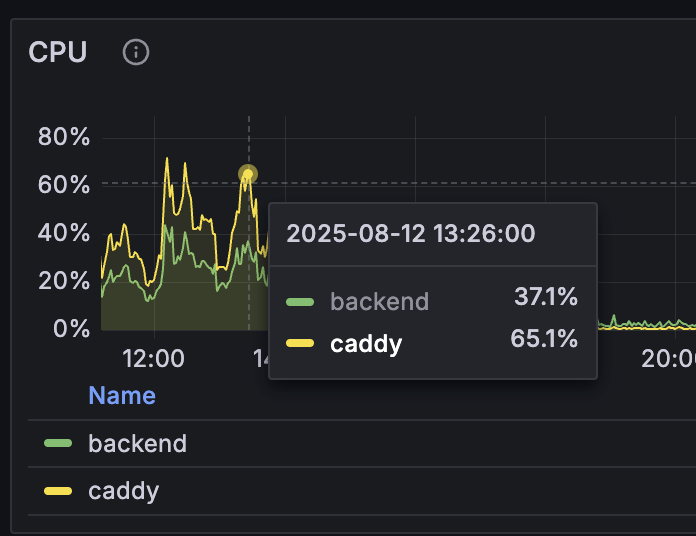
We are using caddy as reverse proxy to our backend(s). But surprisingly at about 10-15 requests/s caddy uses more CPU than the actual application - which has me worried for scaling up.
I would like to find the bottlenecks but don’t quite know how to start best.
Is go profiling the next step - or are there other things to look into first?
2. Error messages and/or full log output:
No error message or any significant log output. Verbosity is set to ERROR.
3. Caddy version:
caddy:2.10.0-alpine
4. How I installed and ran Caddy:
apiVersion: v1
kind: ConfigMap
metadata:
  namespace: infra
  name: caddy
  labels:
    app: caddy
data:
  Caddyfile: | see 4d)
---
apiVersion: apps/v1
kind: Deployment
metadata:
  namespace: infra
  name: caddy
  labels:
    app: caddy
  annotations:
    reloader.stakater.com/auto: "true"
spec:
  replicas: 1
  selector:
    matchLabels:
      app: caddy
  template:
    metadata:
      labels:
        app: caddy
      annotations:
        prometheus.io/scrape: "true"
        prometheus.io/port: "2019"
        prometheus.io/path: "/metrics"
    spec:
      containers:
        - name: caddy
          image: caddy:2.10.0-alpine
          ports:
            - name: http
              containerPort: 80
            - name: https
              containerPort: 443
            - name: admin
              containerPort: 2019
          env:
            - name: MAINTENANCE_LIVE
              valueFrom:
                secretKeyRef:
                  name: maintenance
                  key: live
            - name: MAINTENANCE_TEST
              valueFrom:
                secretKeyRef:
                  name: maintenance
                  key: test
          volumeMounts:
            - name: caddy-config
              mountPath: /etc/caddy
            - name: caddy-data
              mountPath: /data
          livenessProbe:
            initialDelaySeconds: 2
            httpGet:
              path: /metrics
              port: admin
          readinessProbe:
            initialDelaySeconds: 2
            httpGet:
              path: /metrics
              port: admin
          securityContext:
            allowPrivilegeEscalation: false
            runAsUser: 65534
            runAsGroup: 65534
          resources:
            requests:
              memory: 100Mi
            limits:
              memory: 300Mi
      volumes:
        - name: caddy-config
          configMap:
            name: caddy
        - name: caddy-data
          persistentVolumeClaim:
            claimName: caddy-data-volume-claim
a. System environment:
k3s (v1.32.7+k3s1) on nixOS
uname -a
Linux blue-c-1 6.12.19-hardened1 #1-NixOS SMP PREEMPT_DYNAMIC Thu Mar 13 12:02:20 UTC 2025 x86_64 GNU/Linux
b. Command:
see 4)
. Service/unit/compose file:
see 4)
d. My complete Caddy config:
    {
      email "tcurdt@redacted.org"
      admin :2019
      metrics
    }

    www.redacted.com {
      redir https://redacted.com{uri} permanent
    }

    redacted.com {
      header -server

      header /robots.txt     cache-control "public, max-age=86400" # 1 day
      header /sitemap.xml    cache-control "public, max-age=86400" # 1 day
      header /manifest.json  cache-control "public, max-age=86400" # 1 day
      header /favicon.png    cache-control "public, max-age=604800" # 1 week
      header /img/*          cache-control "public, max-age=604800" # 1 week
      header /p/script.js    cache-control "public, max-age=604800" # 1 week
      header /fonts/*        cache-control "public, max-age=2592000" # 1 month

      # no caching
      header /service-worker.js  cache-control "no-cache"
      header /sw.js              cache-control "no-cache"
      header /_app/version.*     cache-control "no-cache"
      header /api/*              cache-control "no-cache"
      header /webhooks/*         cache-control "no-cache"
      header /sentry/*           cache-control "no-cache"

      # immutables
      header /_app/immutable cache-control "public, max-age=2592000, immutable"
      header /assets/*       cache-control "public, max-age=2592000, immutable"
      header /audio/*        cache-control "public, max-age=2592000, immutable"

      header {
        referrer-policy "same-origin"

        content-security-policy "default-src 'self'; img-src 'self' blob: ; script-src 'self' 'unsafe-inline'; style-src 'self' 'unsafe-inline'; worker-src 'self' blob: ; connect-src 'self'"

        access-control-allow-origin https://redacted.com
        access-control-allow-methods GET, OPTIONS, HEAD

        x-content-type-options nosniff
        x-frame-options deny
        x-permitted-cross-domain-policies none

        cross-origin-embedder-policy require-corp
        cross-origin-opener-policy same-origin
        cross-origin-resource-policy cross-origin

        permissions-policy "geolocation=(), microphone=(), camera=()" # disable browser APIs
      }

      @maintenance {
        expression {env.MAINTENANCE_LIVE} != ""
      }
      handle @maintenance {
        respond "{env.MAINTENANCE_LIVE:We will be back shortly}" 503 {
          close
        }
      }

      @plausible path /p/script.js /p/e
      handle @plausible {
        rewrite /p/script.js /js/script.js
        rewrite /p/e /api/event
        reverse_proxy https://plausible.io {
          header_up Host {http.reverse_proxy.upstream.hostport}
        }
      }

      handle /ws/* {
        header Access-Control-Allow-Origin "https://redacted.com"
        reverse_proxy backend.live.svc.cluster.local:3001 {
          lb_try_duration 5s
          fail_duration 5s
        }
      }

      handle {
        reverse_proxy backend.live.svc.cluster.local:3000 {
          lb_try_duration 5s
          fail_duration 5s
        }
      }
    }

    old.redacted.com {
      header -server

      handle /feedback* {
        rewrite * /old{uri}
        reverse_proxy backend.test.svc.cluster.local:3000 {
          lb_try_duration 5s
          fail_duration 5s
        }
      }

      handle {
        respond 404
      }
    }