I’m considering deploying a fleet of Caddy servers to act as the entry point of an app and handle custom domains HTTPS, similar to what’s described here.
So I was wondering, what are the common tools to monitor Caddy? Is there something similar to NGINX Amplify? Other third party? Well, basically any piece of information regarding this is more than welcome.
This doesn’t help you in the here and now, but we’re planning on building an official monitoring and/or config management service in the coming months, FWIW.
Hi matt!
Something official would be fantastic and imho would be a great point of leverage when deciding on using Caddy.
Regarding what kind of information. I don’t have any specific requirements except that I’d love to be able to see metrics per route (like /home ) or group of routes (like /messages/* ), I have absolutely no idea if that’s too crazy to ask but would be really useful.
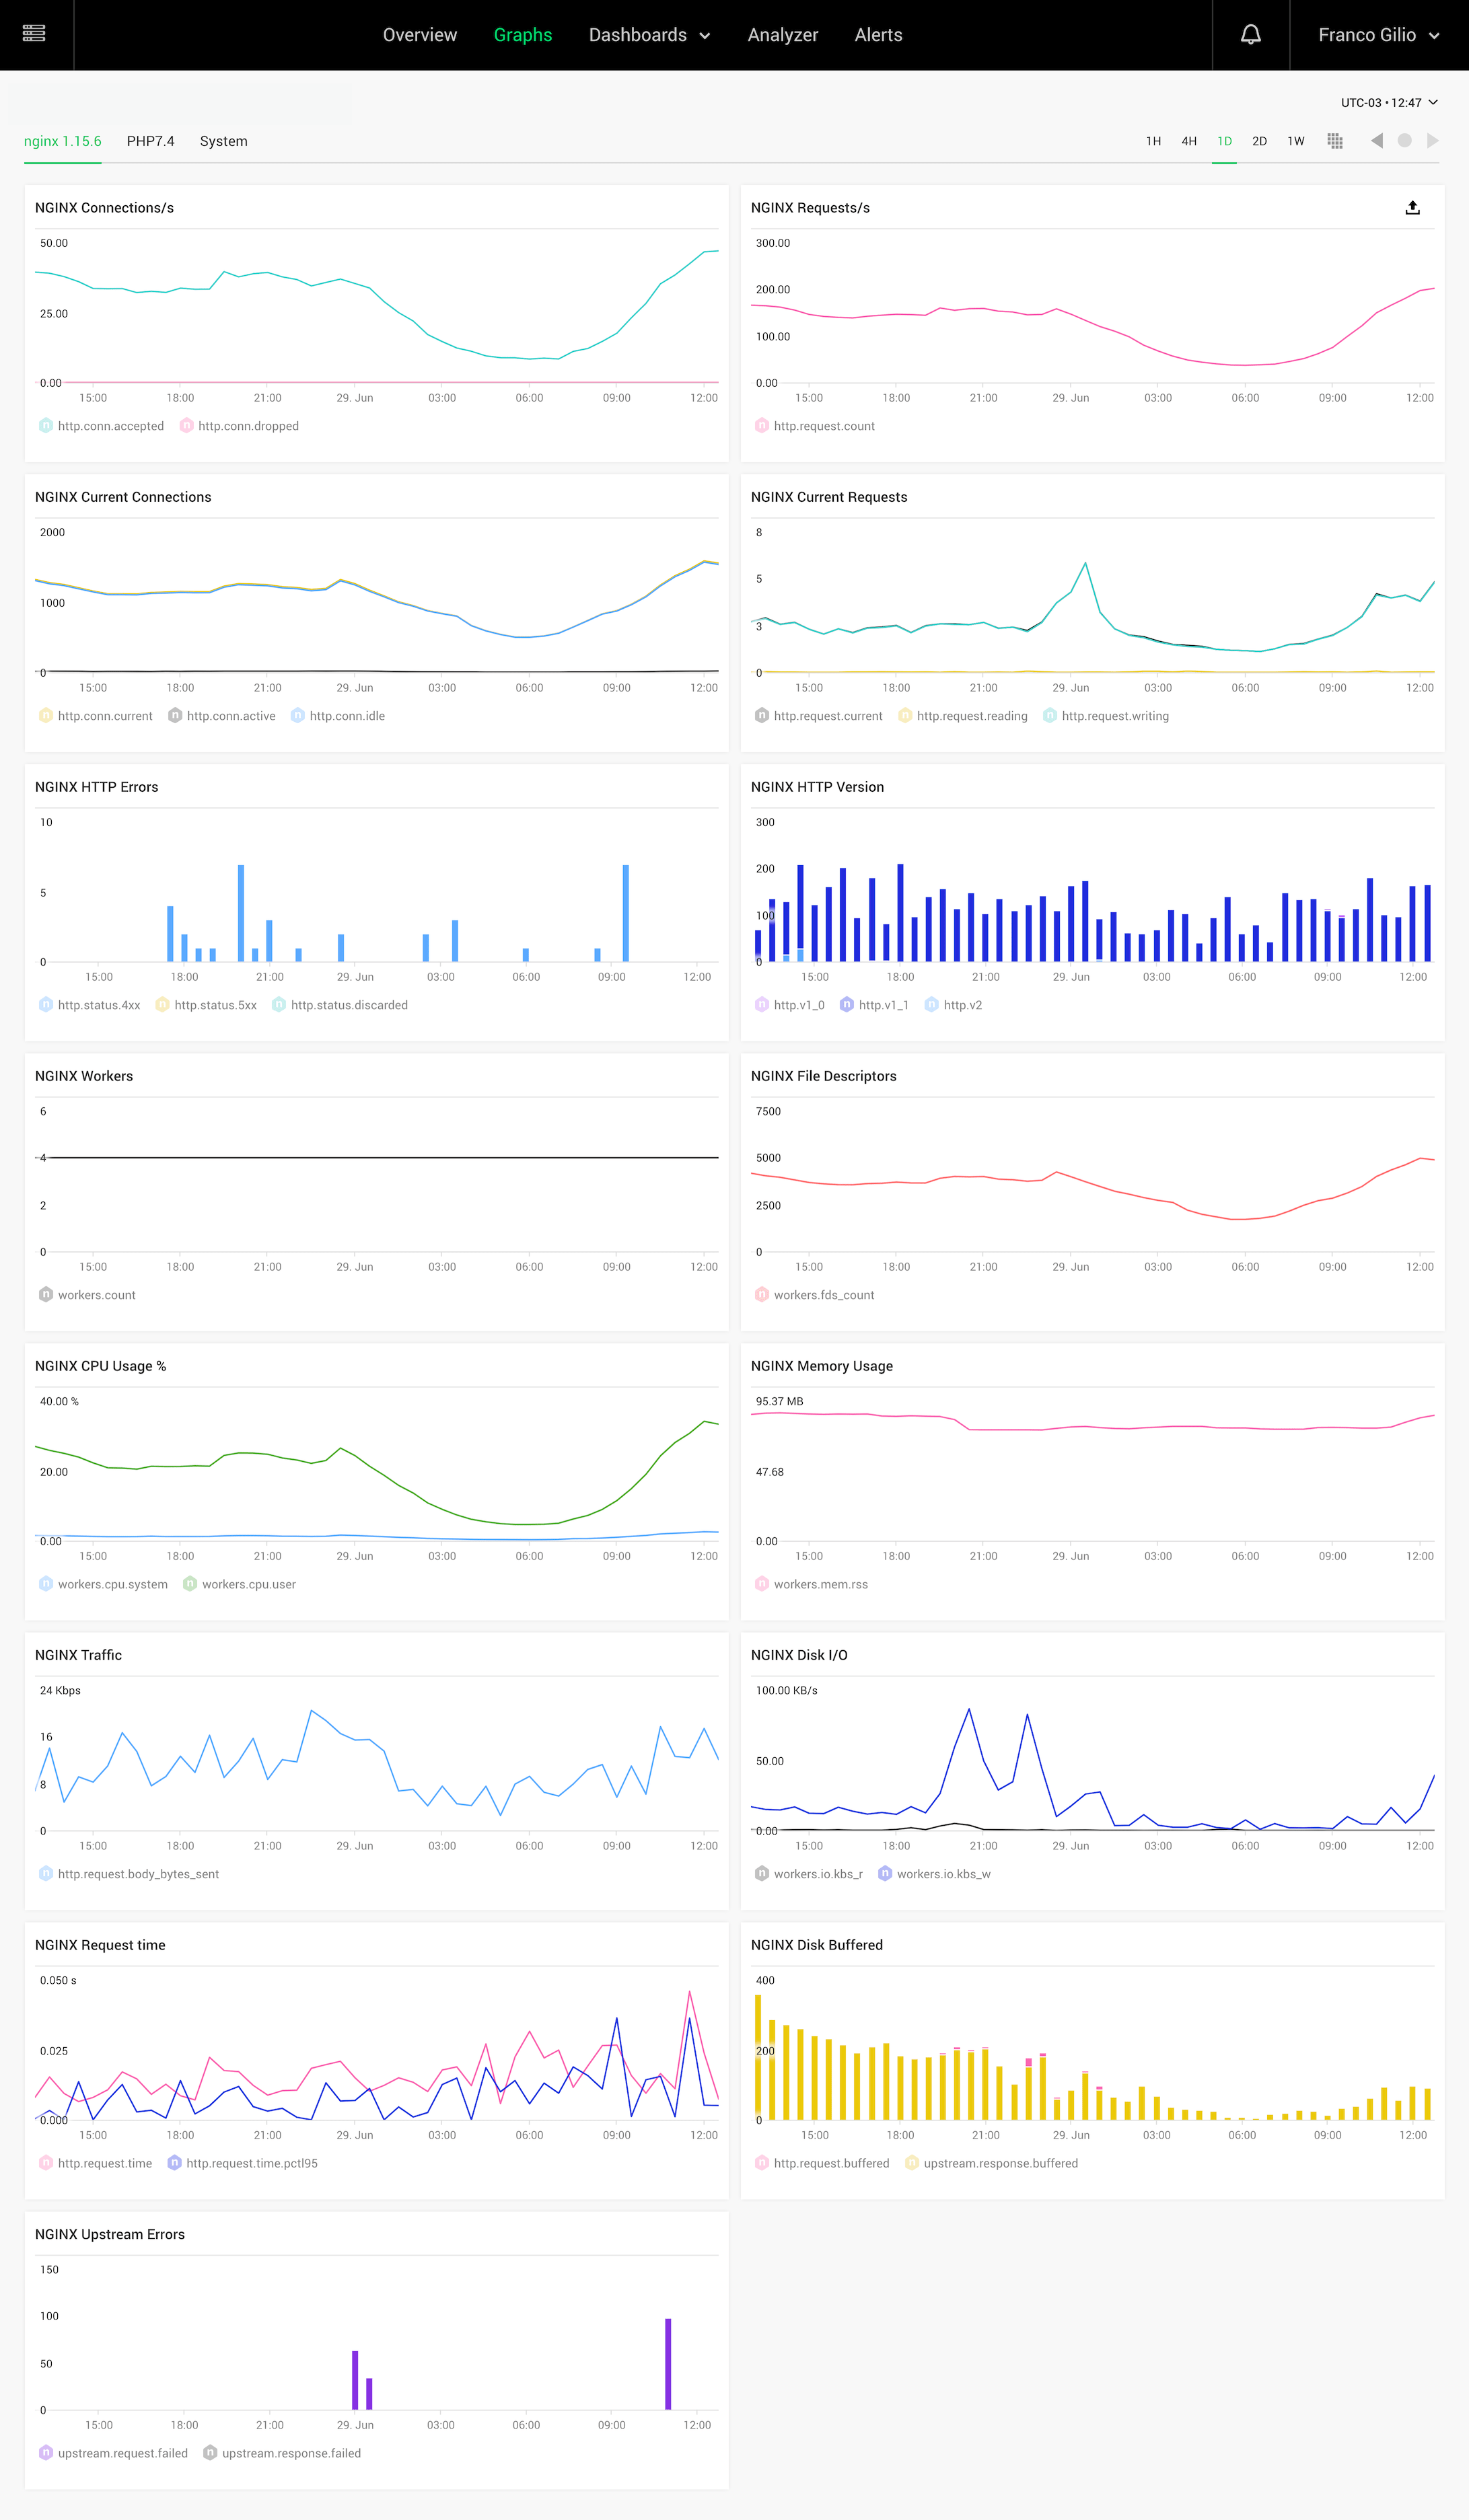
Other than that, what Amplify shows by default is plenty useful for my current needs. It’s pretty useful that you can see metrics by server and also aggregated .